Marketplace & Dashboard
Lucid’s VEO Marketplace provides a unified interface for discovering, monitoring, and participating in active and historical Vested Emission Offerings across supported ecosystems.
The marketplace enables users to:
- browse active VEO markets
- monitor protocol liquidity programmes
- analyse market metrics
- track vesting positions
- manage purchased VEOs
- monitor ecosystem participation
Accessing the Marketplace
Users can access the VEO Marketplace directly from the Lucid App page.
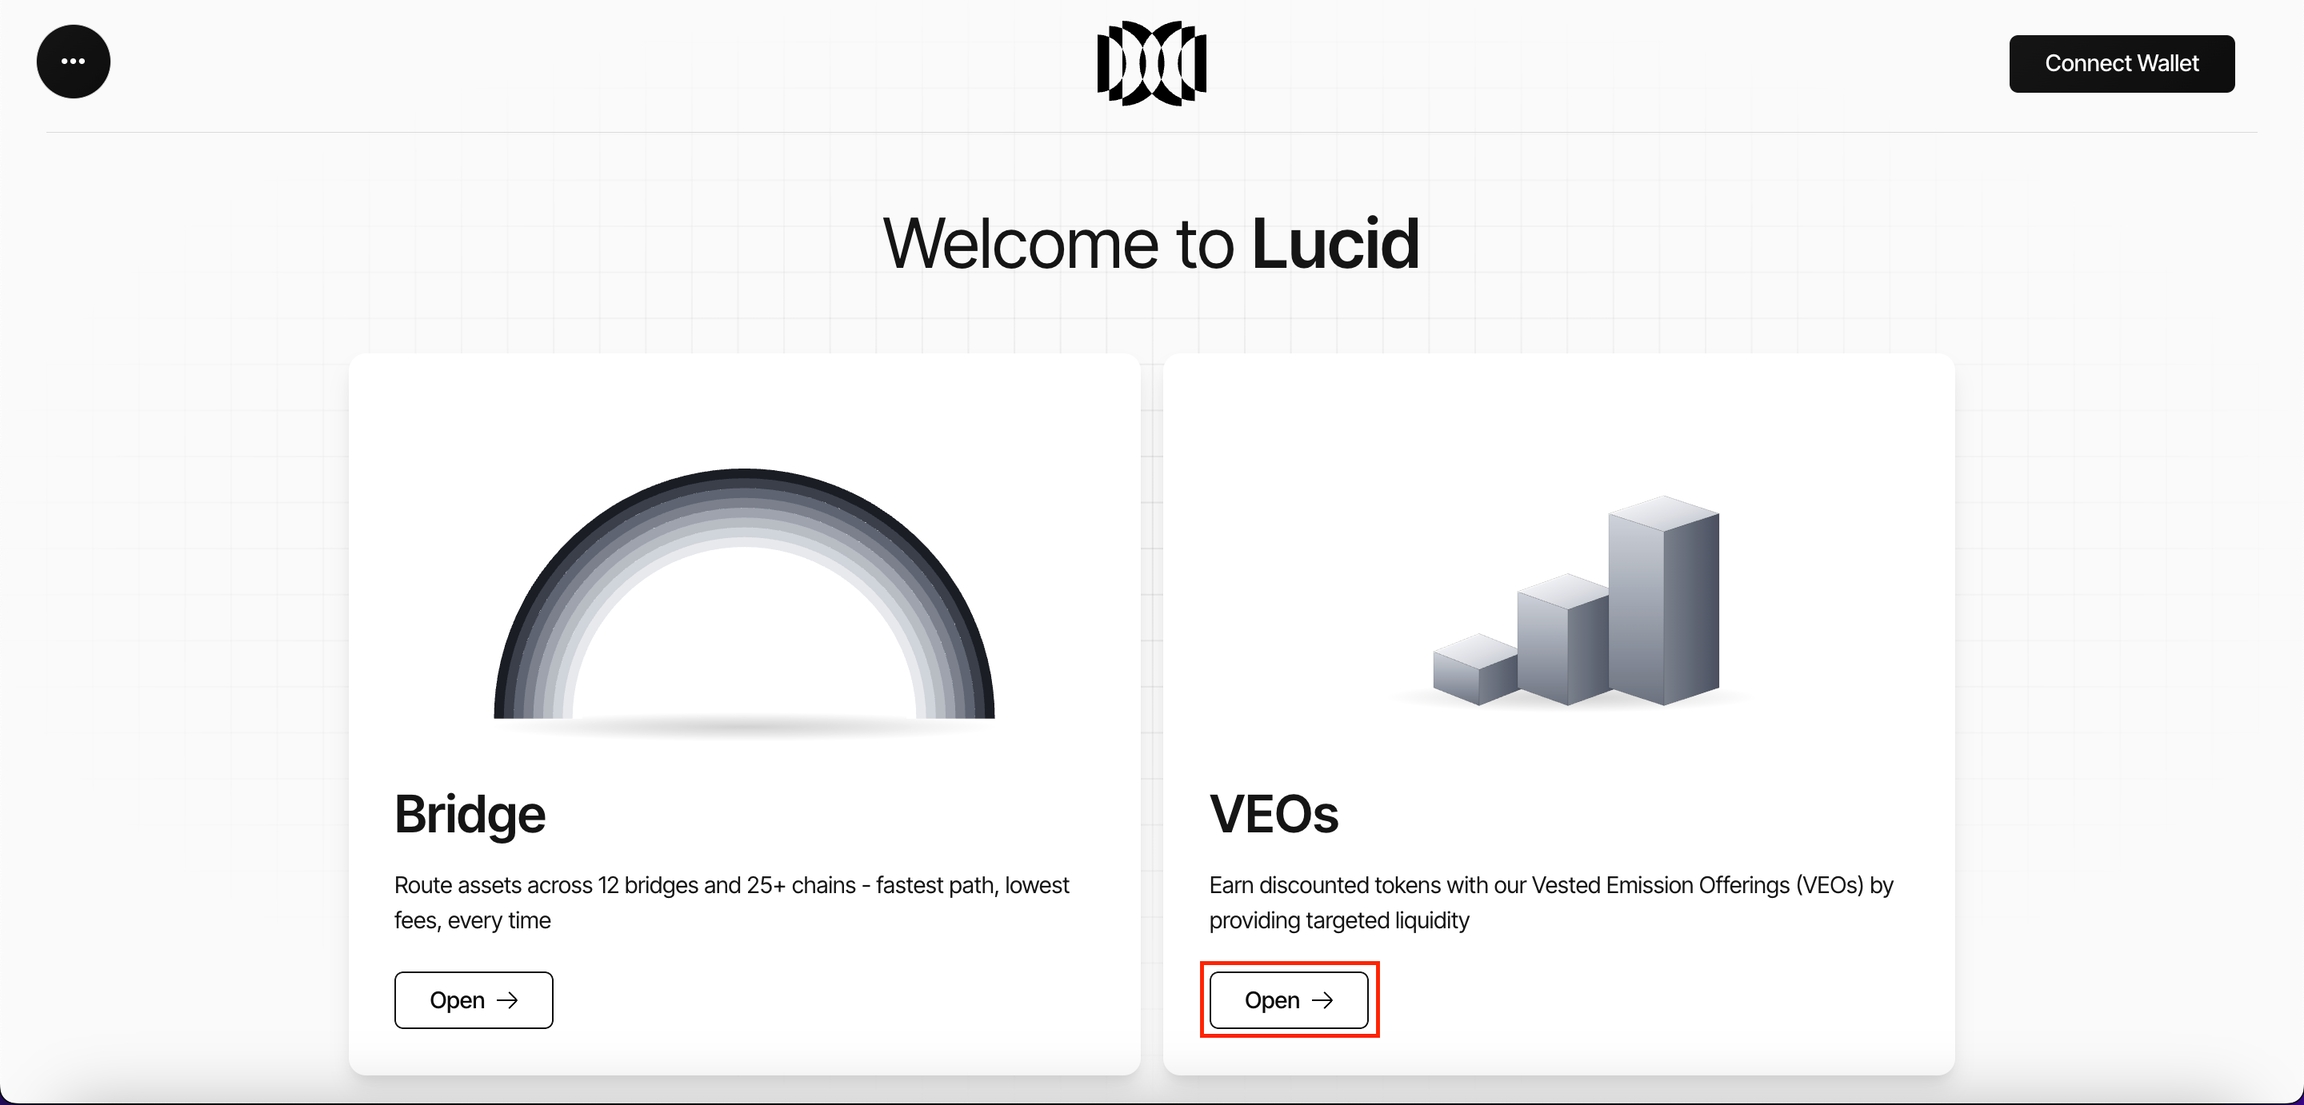
- Navigate to the VEOs section.
- Click Open.
After opening the marketplace, users can view all active and historical VEO markets across supported organisations.
Marketplace Metrics
The marketplace dashboard displays aggregated ecosystem-wide VEO statistics.
Key metrics include:
| Metric | Description |
|---|---|
| Total Value Locked (TVL) | Combined value of assets participating across all VEOs |
| Total VEOs | Total number of active and historical VEO markets |
| Unique Buyers | Total number of distinct participating wallet addresses |
These metrics provide visibility into overall market participation and liquidity coordination activity.
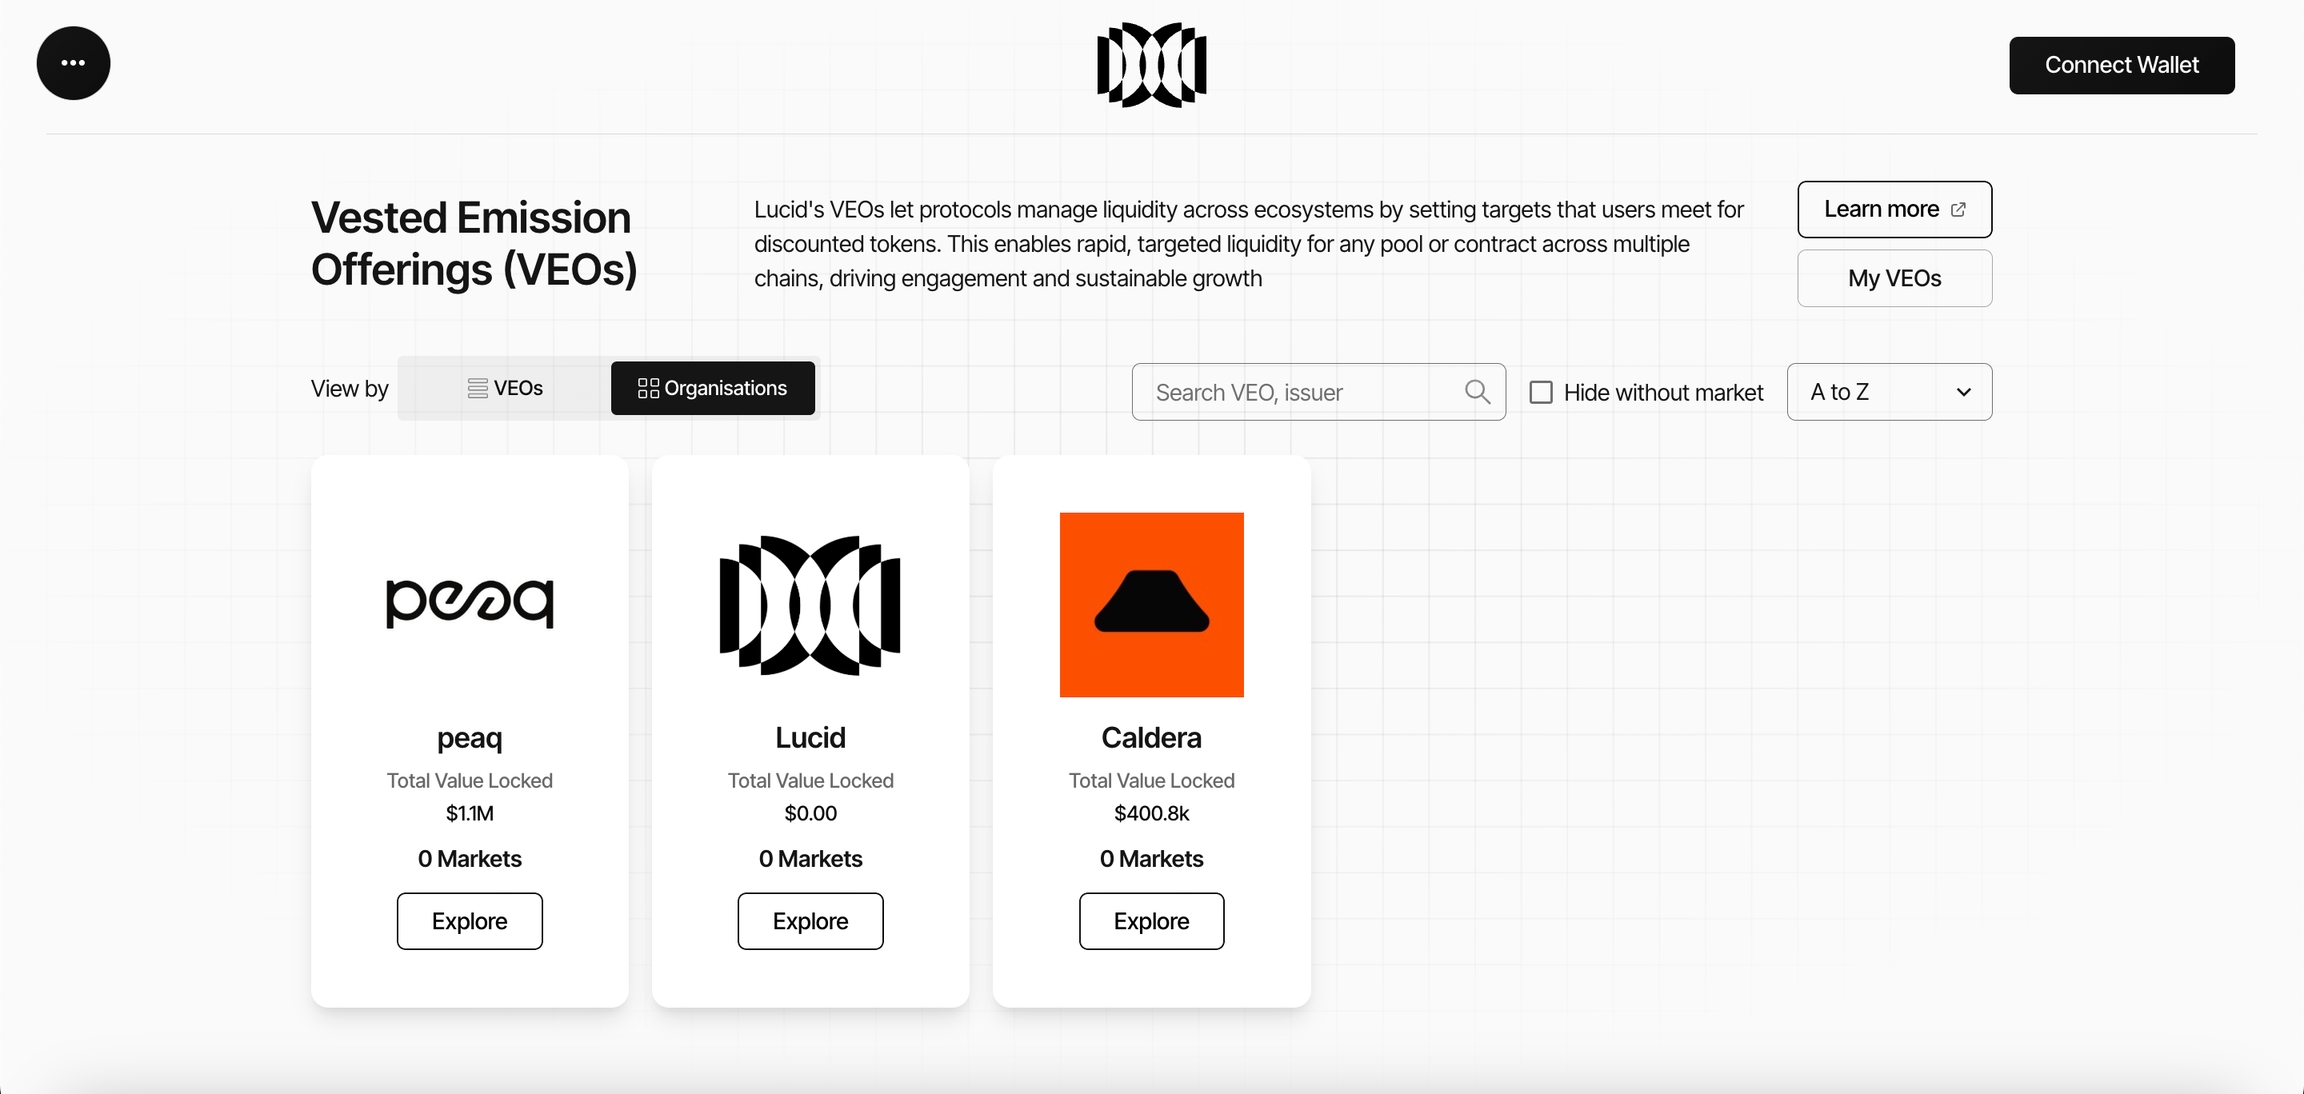
Marketplace Views
The marketplace supports two primary views:
| View | Description |
|---|---|
| VEOs View | Displays all available VEO markets directly |
| Organisations View | Groups VEOs by issuing organisation or ecosystem |
This allows users to either:
- explore individual VEO opportunities
- or analyse ecosystem-level VEO activity
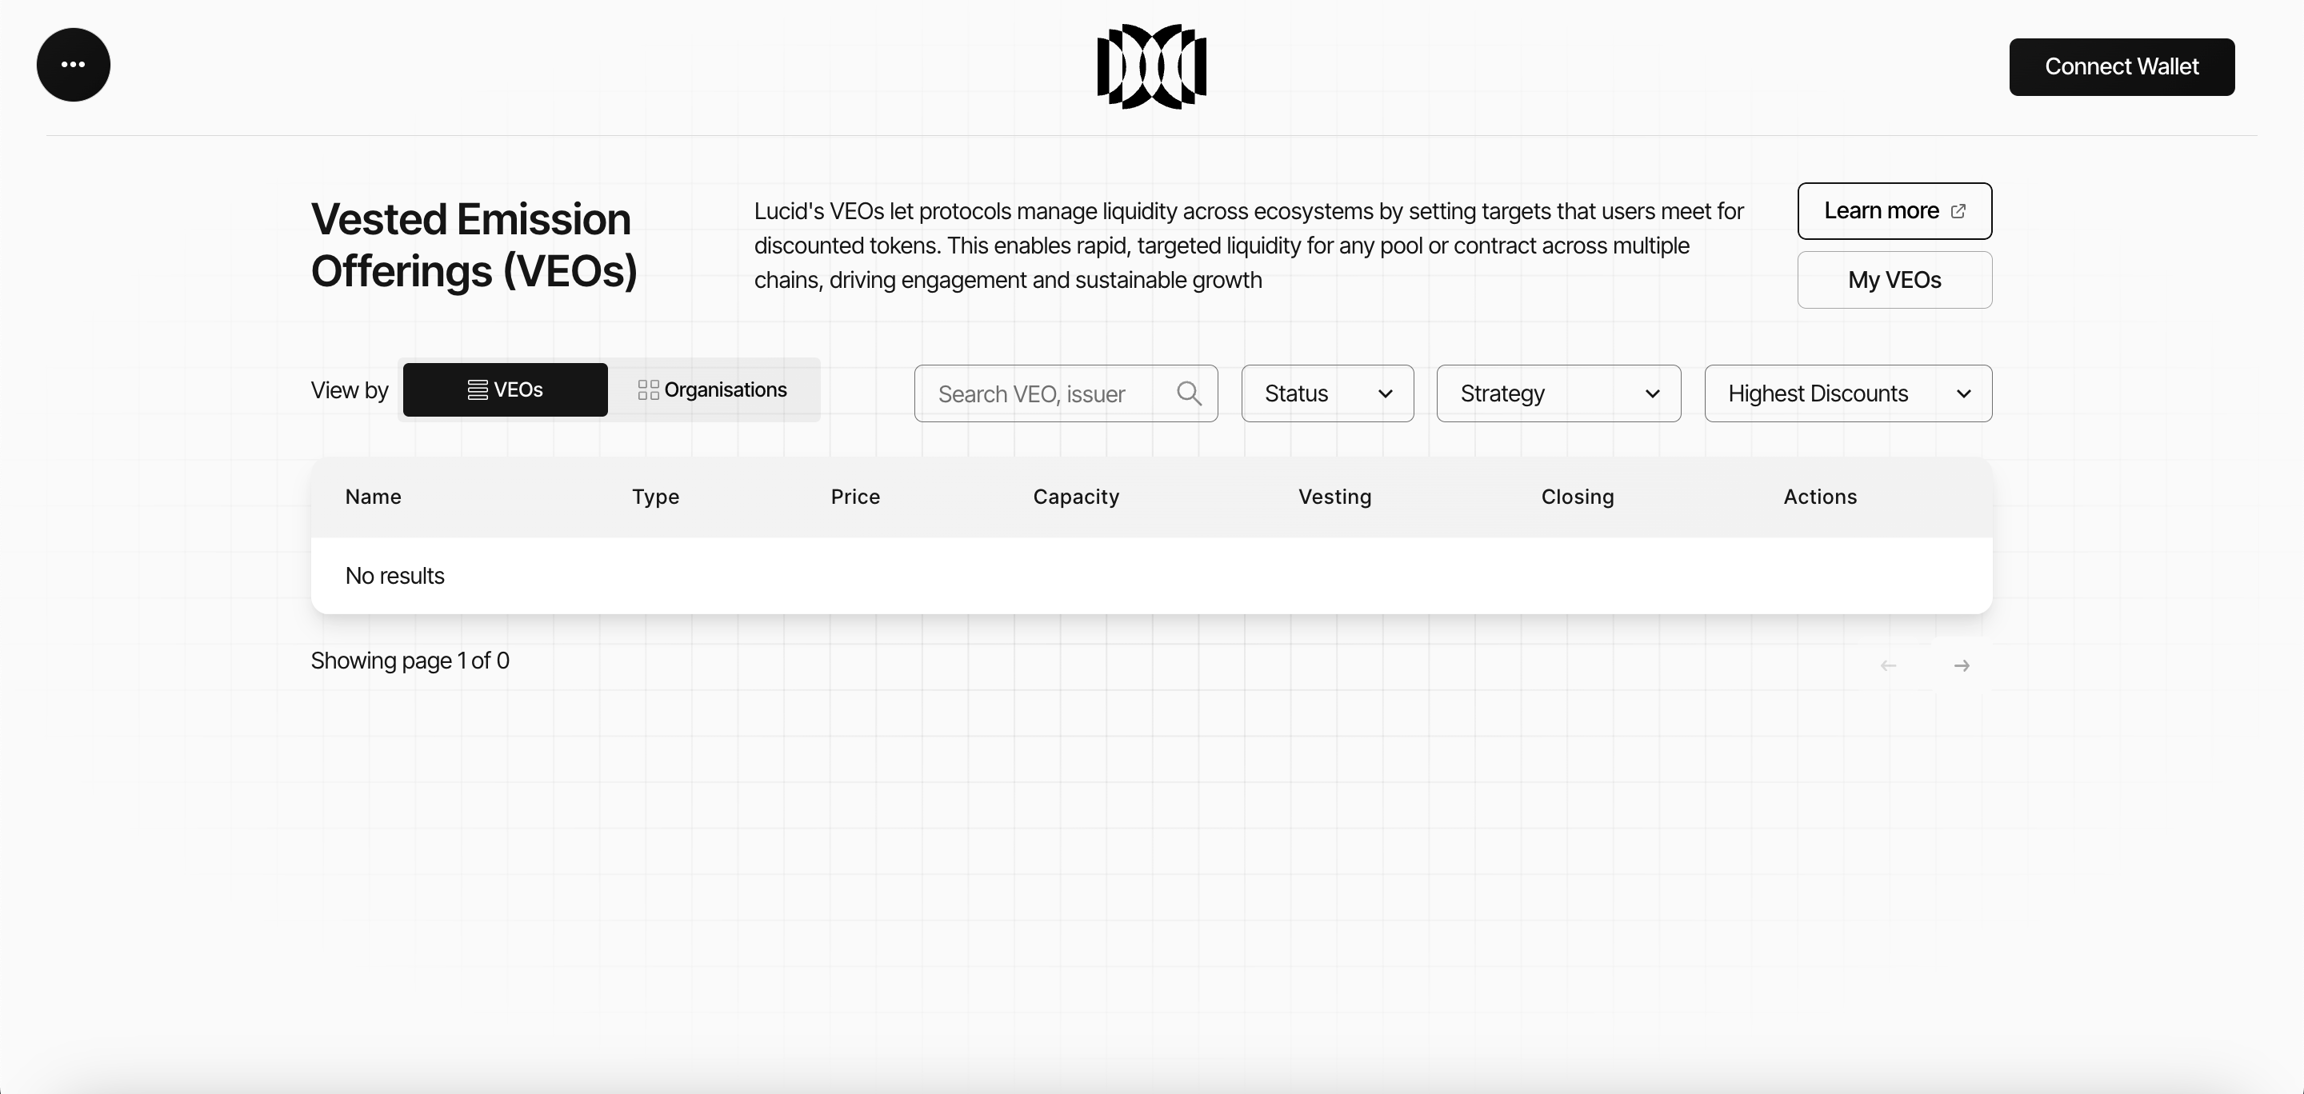
Marketplace Filters
The marketplace includes filtering and sorting infrastructure to simplify VEO discovery.
Supported filters include:
| Filter | Purpose |
|---|---|
| Search | Search by VEO name or organisation |
| Status | Filter live or closed VEOs |
| VEO Type | Filter Strategic, Liquidity, or TVL VEOs |
| Price Strategy | Filter by pricing model |
| Discount Sorting | Sort by highest or lowest discounts |
These filters allow users to navigate large numbers of VEO markets efficiently.
Organisation Dashboard
Each organisation has a dedicated VEO dashboard displaying ecosystem-specific VEO activity and analytics.
The organisation dashboard includes:
- organisation profile information
- supported chains
- creation date
- organisation description
- VEO management access
- external ecosystem links
Dashboard Metrics
The dashboard provides real-time visibility into organisation-level VEO activity.
Key metrics include:
| Metric | Description |
|---|---|
| Total Value Locked | Total value locked across organisation VEOs |
| Total VEOs | Number of VEO markets created by the organisation |
| Unique Bonders | Number of distinct participating addresses |
The dashboard also includes liquidity distribution visualisation across:
- Strategic Asset VEOs
- Liquidity VEOs
- TVL VEOs
Supported timeframes include:
- 1D
- 7D
- All
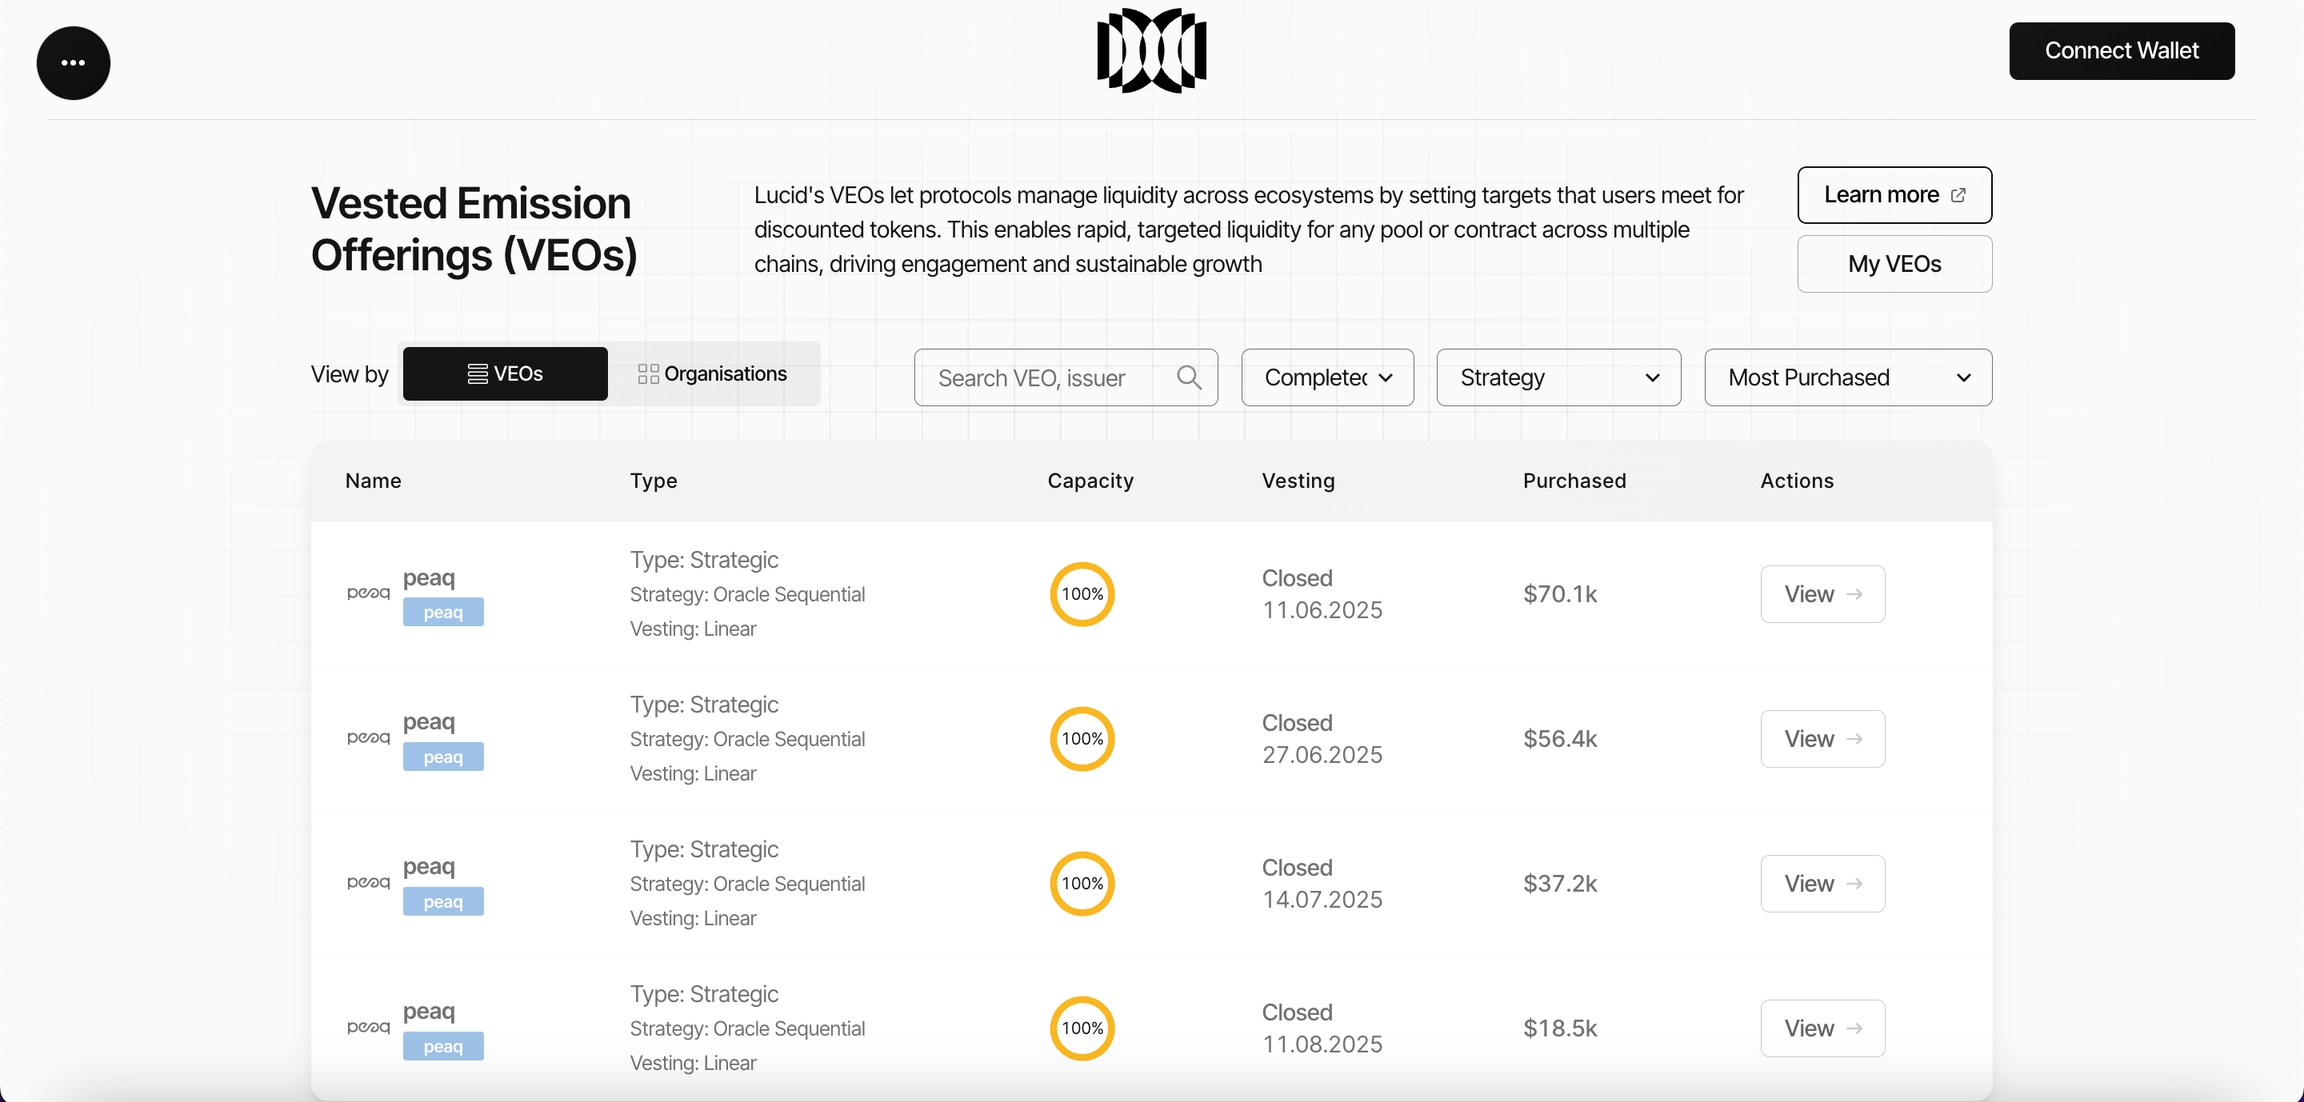
Available Markets
The Available Markets section displays active VEO opportunities available for participation.
Each market includes:
| Field | Description |
|---|---|
| Name | Issuing organisation and deployment chain |
| Type | VEO structure and pricing strategy |
| Price | Current token price and discount |
| Capacity | Percentage of allocation filled |
| Vesting | Vesting duration and expiry date |
| Actions | Access detailed market participation page |
This interface allows users to compare:
- discounts
- vesting structures
- market capacity
- pricing strategies
- supported ecosystems
before participating in a VEO.
My VEOs Dashboard
The My VEOs dashboard provides users with a personalised overview of their VEO participation and vesting activity.
Users can access this dashboard through:
- the My VEOs button
- the sidebar dashboard navigation
The dashboard allows users to:
- monitor purchased VEOs
- track vesting progress
- review claimable tokens
- analyse participation history
- manage ongoing VEO positions
Additional claiming and token management flows are covered in the Claiming & Unwrapping Tokens section.